

Electro-physiology and electro-therapeutics : showing the best methods for the medical uses of electricity / By Alfred C. Garratt.
55/740
- Publication/creation
- Boston : Ticknor and Fields, 1861.
- Physical description
- 3 unnumbered pages, 716 pages, 2 leaves of plates : illustrations ; 26 cm
- Contributors
-
Garratt, Alfred C. (Alfred Charles), 1813?-1891
Harvey Cushing/John Hay Whitney Medical Library
- Notes
-
3d ed. has title: Medical electricity
Includes index and testimonials
- Type/technique
- Electronic books
- Subjects
-
Electrophysiology
Electrotherapeutics
- Attribution and usage
-
This material has been provided by the Harvey Cushing/John Hay Whitney Medical Library at Yale University, through the Medical Heritage Library. The original may be consulted at the Harvey Cushing/John Hay Whitney Medical Library at Yale University.
This work has been identified as being free of known restrictions under copyright law, including all related and neighbouring rights and is being made available under the Creative Commons, Public Domain Mark.
You can copy, modify, distribute and perform the work, even for commercial purposes, without asking permission.
The image contains the following text:
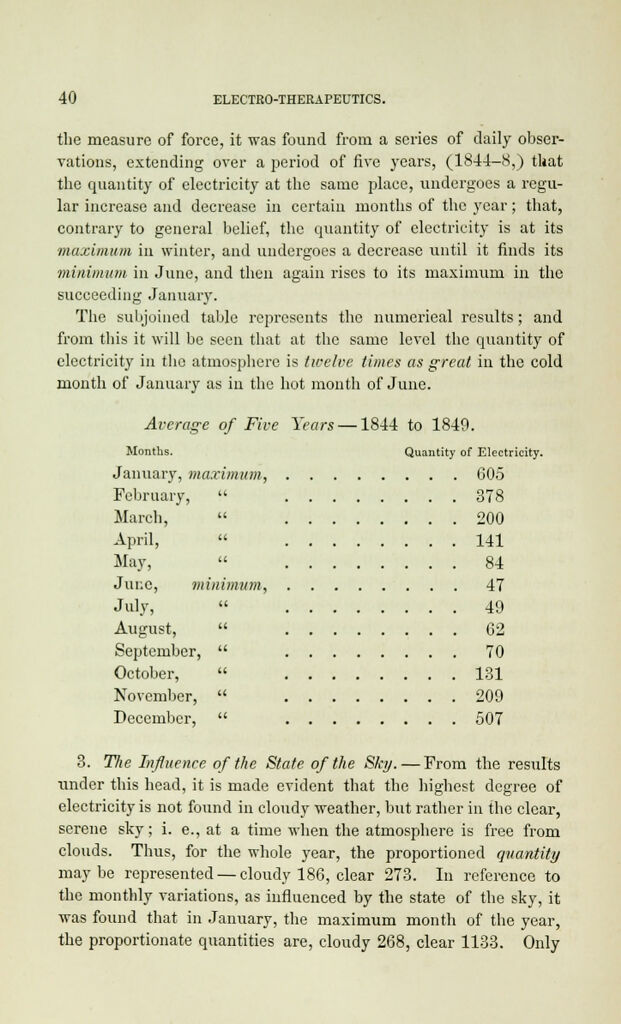
the measure of force, it was found from a series of daily obser-
vations, extending over a period of five years, (1844-8,) that
the quantity of electricity at the same place, undergoes a regu-
lar increase and decrease in certain months of the year; that,
contrary to general belief, the quantity of electricity is at its
maximum in winter, and undergoes a decrease until it finds its
minimum in June, and then again rises to its maximum in the
succeeding January.
The subjoined table represents the numerical results; and
from this it will be seen that at the same level the quantity of
electricity in the atmosphere is twelve limes as great in the cold
month of January as in the hot month of June.
Average of Five Years —1844 to 1849.
Months. Quantity of Electricity.
January, maximum, 605
February, " 378
March, " 200
April, " 141
May, " 84
June, minimum, 47
July, " 49
August, " 62
September, " 70
October, " 131
November, " 209
December, " 507
3. The Influence of the State of the Sky.— From the results
under this head, it is made evident that the highest degree of
electricity is not found in cloudy weather, but rather in the clear,
serene sky; i. e., at a time when the atmosphere is free from
clouds. Thus, for the whole year, the proportioned quantity
maybe represented — cloudy 186, clear 273. In reference to
the monthly variations, as influenced by the state of the sky, it
was found that in January, the maximum month of the year,
the proportionate quantities are, cloudy 268, clear 1133. Only