

[Report 1960] / Medical Officer of Health, Northampton County Borough.
74/128
- Publication/creation
- 1960
- Contributors
- Northampton (England). County Borough Council.
- Type/technique
-
Electronic books
Annual reports
MOH reports
- Subjects
-
Disease Outbreaks
Public Health
Sanitation
Water Supply
Northampton (England)
- Attribution and usage
-
Wellcome Collection
You have permission to make copies of this work under a Creative Commons, Attribution license.
This licence permits unrestricted use, distribution, and reproduction in any medium, provided the original author and source are credited. See the Legal Code for further information.
Image source should be attributed as specified in the full catalogue record. If no source is given the image should be attributed to Wellcome Collection.
The image contains the following text:
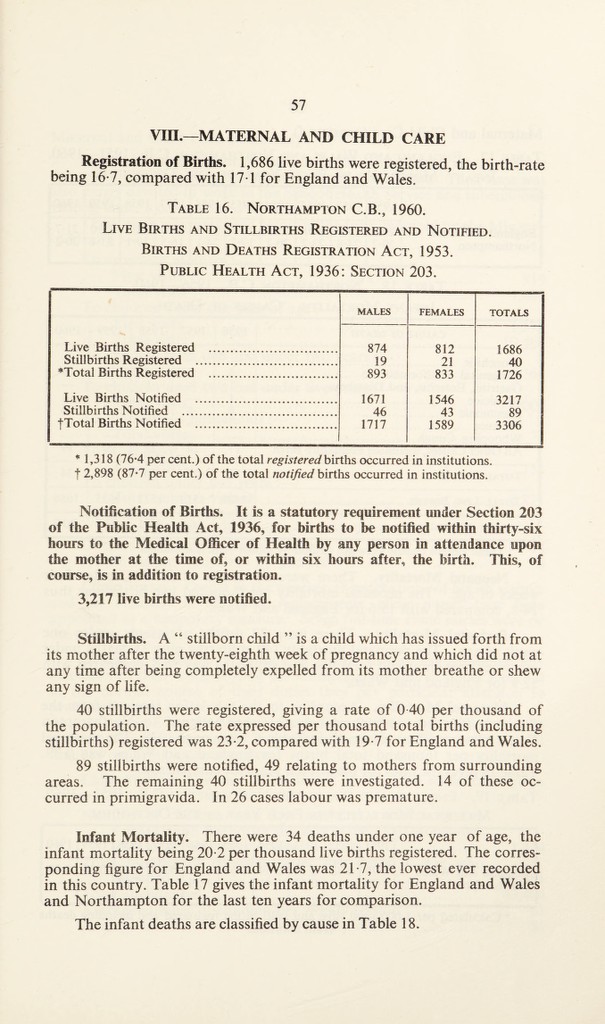
Vin.—MATERNAL AND CHILD CARE
Registration of Births. 1,686 live births were registered, the birth-rate
being 16*7, compared with 17-1 for England and Wales.
Table 16. Northampton C.B., 1960.
Live Births and Stillbirths Registered and Notified.
Births and Deaths Registration Act, 1953.
Public Health Act, 1936: Section 203.
MALES
FEMALES
TOTALS
Live Births Registered .....
874
812
1686
Stillbirths Registered ....
19
21
40
*Total Births Registered .......
893
833
1726
Live Births Notified .....
1671
1546
3217
Stillbirths Notified ......
46
43
89
jTotal Births Notified ....
1717
1589
3306
* 1,318 (76*4 per cent.) of the total registered births occurred in institutions,
f 2,898 (87*7 per cent.) of the total notified births occurred in institutions.
Notification of Births. It is a statutory requirement under Section 203
of the Public Health Act, 1936, for births to be notified within thirty-six
hours to the Medical Officer of Health by any person in attendance upon
the mother at the time of, or within six hours after, the birth. This, of
course, is in addition to registration.
3,217 live births were notified.
Stillbirths. A “ stillborn child ” is a child which has issued forth from
its mother after the twenty-eighth week of pregnancy and which did not at
any time after being completely expelled from its mother breathe or shew
any sign of life.
40 stillbirths were registered, giving a rate of 0 40 per thousand of
the population. The rate expressed per thousand total births (including
stillbirths) registered was 23-2, compared with 19-7 for England and Wales.
89 stillbirths were notified, 49 relating to mothers from surrounding
areas. The remaining 40 stillbirths were investigated. 14 of these oc¬
curred in primigravida. In 26 cases labour was premature.
Infant Mortality. There were 34 deaths under one year of age, the
infant mortality being 20-2 per thousand live births registered. The corres¬
ponding figure for England and Wales was 21-7, the lowest ever recorded
in this country. Table 17 gives the infant mortality for England and Wales
and Northampton for the last ten years for comparison.
The infant deaths are classified by cause in Table 18,