

[Report 1960] / Medical Officer of Health, Northampton County Borough.
34/128
- Publication/creation
- 1960
- Contributors
- Northampton (England). County Borough Council.
- Type/technique
-
Electronic books
Annual reports
MOH reports
- Subjects
-
Disease Outbreaks
Public Health
Sanitation
Water Supply
Northampton (England)
- Attribution and usage
-
Wellcome Collection
You have permission to make copies of this work under a Creative Commons, Attribution license.
This licence permits unrestricted use, distribution, and reproduction in any medium, provided the original author and source are credited. See the Legal Code for further information.
Image source should be attributed as specified in the full catalogue record. If no source is given the image should be attributed to Wellcome Collection.
The image contains the following text:
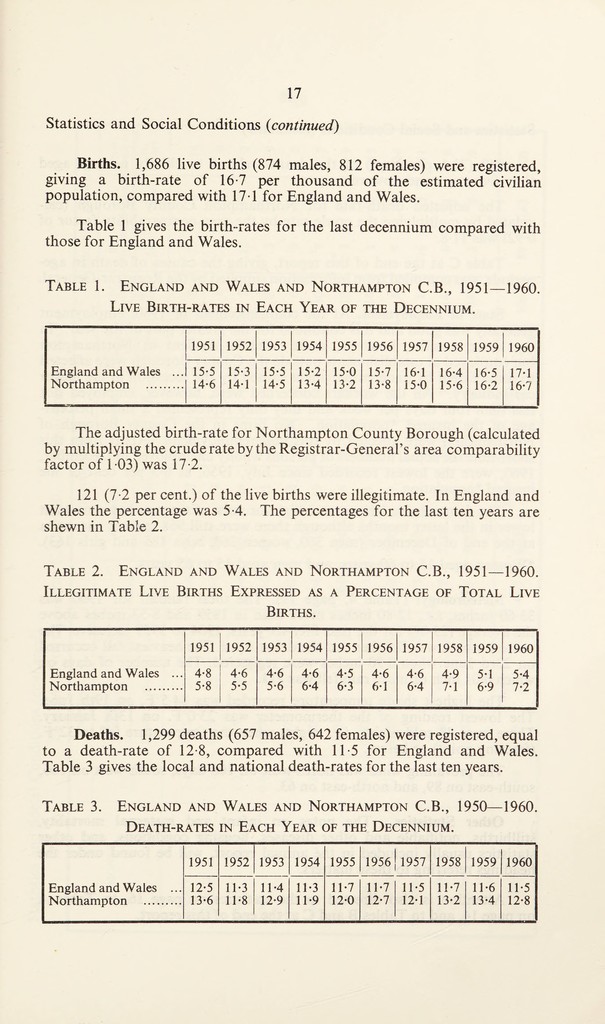
Statistics and Social Conditions (continued)
Births. 1,686 live births (874 males, 812 females) were registered,
giving a birth-rate of 16*7 per thousand of the estimated civilian
population, compared with 17-1 for England and Wales.
Table 1 gives the birth-rates for the last decennium compared with
those for England and Wales.
Table 1. England and Wales and Northampton C.B., 1951—1960.
Live Birth-rates in Each Year of the Decennium.
England and Wales
Northampton
1951
1952
1953
1954
1955
1956
1957
1958
15-5
14*6
15-3
14*1
15*5
14*5
15*2
13*4
15*0
13*2
15*7
13*8
16*1
15*0
16*4
15*6
1959
16-5
16*2
1960
17-1
16*7
The adjusted birth-rate for Northampton County Borough (calculated
by multiplying the crude rate by the Registrar-General’s area comparability
factor of 1 03) was 17*2.
121 (7*2 per cent.) of the live births were illegitimate. In England and
Wales the percentage was 5-4. The percentages for the last ten years are
shewn in Table 2.
Table 2. England and Wales and Northampton C.B., 1951—1960.
Illegitimate Live Births Expressed as a Percentage of Total Live
Births.
1951
1952
1953
1954
1955
1956
1957
1958
1959
1960
England and Wales ...
4*8
4*6
4*6
4*6
4*5
4*6
4*6
4*9
5*1
5*4
Northampton .
5*8
5*5
5*6
6*4
6*3
6*1
6*4
7*1
6*9
7*2
Deaths. 1,299 deaths (657 males, 642 females) were registered, equal
to a death-rate of 12*8, compared with 11-5 for England and Wales.
Table 3 gives the local and national death-rates for the last ten years.
Table 3. England and Wales and Northampton C.B., 1950—1960.
Death-rates in Each Year of the Decennium.
England and Wales ...
Northampton .
1951
1952
1953
1954
1955
1956
1957
1958
1959
1960
12*5
13*6
11*3
11*8
11*4
12*9
11*3
11*9
11*7
12*0
11*7
12*7
11*5
12*1
11*7
13*2
11*6
13*4
11*5
12*8