

[Report 1960] / Medical Officer of Health, Northampton County Borough.
70/128
- Publication/creation
- 1960
- Contributors
- Northampton (England). County Borough Council.
- Type/technique
-
Electronic books
Annual reports
MOH reports
- Subjects
-
Disease Outbreaks
Public Health
Sanitation
Water Supply
Northampton (England)
- Attribution and usage
-
Wellcome Collection
You have permission to make copies of this work under a Creative Commons, Attribution license.
This licence permits unrestricted use, distribution, and reproduction in any medium, provided the original author and source are credited. See the Legal Code for further information.
Image source should be attributed as specified in the full catalogue record. If no source is given the image should be attributed to Wellcome Collection.
The image contains the following text:
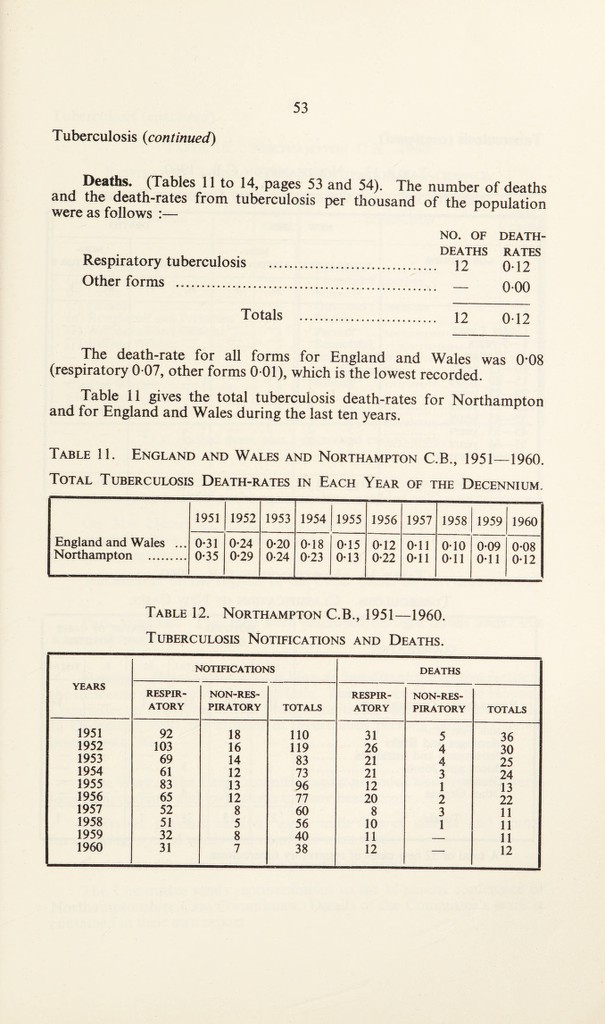
Deaths. (Tables 11 to 14, pages 53 and 54). The number of deaths
and the death-rates from tuberculosis per thousand of the population
were as follows :—
NO. OF DEATH-
„ ... DEATHS RATES
Respiratory tuberculosis . 12 q-12
Other forms . __ q.qq
Totals . 12 012
The death-rate for all forms for England and Wales was 0*08
(respiratory 0 07, other forms 0 01), which is the lowest recorded.
Table 11 gives the total tuberculosis death-rates for Northampton
and for England and Wales during the last ten years.
Table 11. England and Wales and Northampton C.B., 1951_1960.
Total Tuberculosis Death-rates in Each Year of the Decennium.
England and Wales
Northampton .
1951
1952
1953
1954
1955
1956
1957
1958
1959
1960
0*31
0*35
0-24
0-29
0-20
0-24
0-18
0-23
0-15
0-13
0-12
0-22
0-11
0-11
0-10
0-11
0*09
0-11
0-08
0-12
YEARS
1951
1952
1953
1954
1955
1956
1957
1958
1959
1960
Table 12. Northampton C.B., 1951—1960.
Tuberculosis Notifications and Deaths.
NOTIFICATIONS
DEATHS
RF.SPIR-
NON-RES-
RESPIR-
NON-RES-
ATORY
PIRATORY
TOTALS
ATORY
PIRATORY
TOTALS
92
18
110
31
5
36
103
16
119
26
4
30
69
14
83
21
4
25
61
12
73
21
3
24
83
13
96
12
1
13
65
12
77
20
2
22
52
8
60
8
3
11
51
5
56
10
1
11
32
8
40
11
—
11
31
7
38
12
—
12