

[Report 1960] / Medical Officer of Health, Northampton County Borough.
33/128
- Publication/creation
- 1960
- Contributors
- Northampton (England). County Borough Council.
- Type/technique
-
Electronic books
Annual reports
MOH reports
- Subjects
-
Disease Outbreaks
Public Health
Sanitation
Water Supply
Northampton (England)
- Attribution and usage
-
Wellcome Collection
You have permission to make copies of this work under a Creative Commons, Attribution license.
This licence permits unrestricted use, distribution, and reproduction in any medium, provided the original author and source are credited. See the Legal Code for further information.
Image source should be attributed as specified in the full catalogue record. If no source is given the image should be attributed to Wellcome Collection.
The image contains the following text:
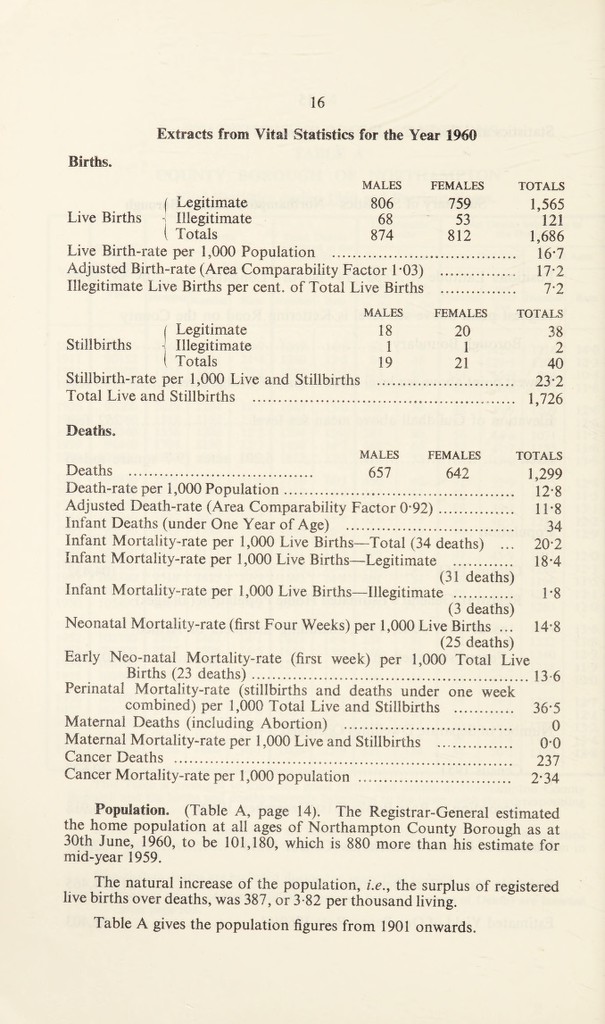
Extracts from Vital Statistics for the Year 1960
Births.
MALES FEMALES TOTALS
f Legitimate 806 759 1,565
Live Births illegitimate 68 53 121
l Totals 874 812 1,686
Live Birth-rate per 1,000 Population ... 16*7
Adjusted Birth-rate (Area Comparability Factor 1 '03) ... 17*2
Illegitimate Live Births per cent, of Total Live Births .. 7*2
MALES FEMALES TOTALS
f Legitimate 18 20 38
Stillbirths , Illegitimate 1 l 2
( Totals 19 21 40
Stillbirth-rate per 1,000 Live and Stillbirths . 23*2
Total Live and Stillbirths ... 1,726
Deaths,
MALES FEMALES TOTALS
Deaths .... 657 642 1,299
Death-rate per 1,000 Population... 12*8
Adjusted Death-rate (Area Comparability Factor 0*92). 11*8
Infant Deaths (under One Year of Age) . 34
Infant Mortality-rate per 1,000 Live Births—Total (34 deaths) ... 20*2
Infant Mortality-rate per 1,000 Live Births—Legitimate . 18*4
(31 deaths)
Infant Mortality-rate per 1,000 Live Births—Illegitimate . 1*8
(3 deaths)
Neonatal Mortality-rate (first Four Weeks) per 1,000 Live Births ... 14*8
(25 deaths)
Early Neo-natal Mortality-rate (first week) per 1,000 Total Live
Births (23 deaths) ......13 6
Perinatal Mortality-rate (stillbirths and deaths under one week
combined) per 1,000 Total Live and Stillbirths . 36*5
Maternal Deaths (including Abortion) .. o
Maternal Mortality-rate per 1,000 Live and Stillbirths . 0*0
Cancer Deaths .. 237
Cancer Mortality-rate per 1,000 population .... 2*34
Population. (Table A, page 14). The Registrar-General estimated
the home population at all ages of Northampton County Borough as at
30th June, 1960, to be 101,180, which is 880 more than his estimate for
mid-year 1959.
The natural increase of the population, i.e., the surplus of registered
live births over deaths, was 387, or 3*82 per thousand living.
Table A gives the population figures from 1901 onwards.