

[Report 1960] / Medical Officer of Health, Northampton County Borough.
31/128
- Publication/creation
- 1960
- Contributors
- Northampton (England). County Borough Council.
- Type/technique
-
Electronic books
Annual reports
MOH reports
- Subjects
-
Disease Outbreaks
Public Health
Sanitation
Water Supply
Northampton (England)
- Attribution and usage
-
Wellcome Collection
You have permission to make copies of this work under a Creative Commons, Attribution license.
This licence permits unrestricted use, distribution, and reproduction in any medium, provided the original author and source are credited. See the Legal Code for further information.
Image source should be attributed as specified in the full catalogue record. If no source is given the image should be attributed to Wellcome Collection.
The image contains the following text:
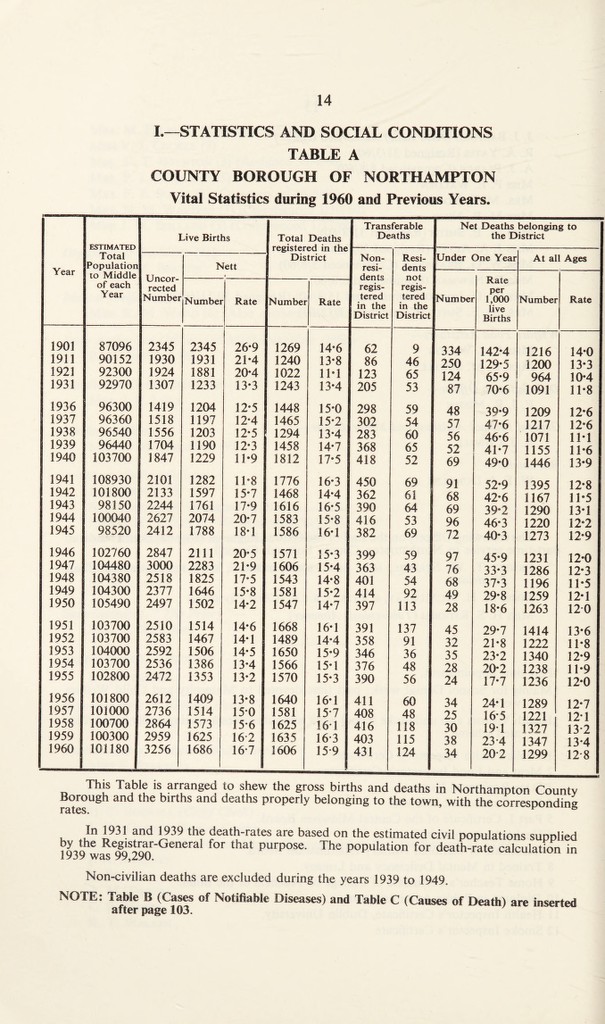
I.—STATISTICS AND SOCIAL CONDITIONS
TABLE A
COUNTY BOROUGH OF NORTHAMPTON
Vital Statistics during 1960 and Previous Years.
Year
ESTIMATED
Total
Population
to Middle
of each
Year
Live Births
Total
register
Deaths
ed in the
trict
Transferable
Deaths
Net Deaths belonging to
the District
Non-
resi-
dp.ntc
Resi¬
dents
not
regis¬
tered
in the
District
Under One Year
At all Ages
Uncor¬
rected
Number
Nett
Dis
Number
Rate
per
1,000
live
Births
Number
Rate
Number
Rate
Number
Rate
regis¬
tered
in the
District
1901
87096
2345
2345
26-9
1269
14*6
62
9
334
142*4
1216
14*0
1911
90152
1930
1931
21*4
1240
13*8
86
46
250
129*5
1200
13*3
1923
92300
1924
1881
20*4
1022
1M
123
65
124
65*9
964
10*4
1931
92970
1307
1233
13-3
1243
13*4
205
53
87
70*6
1091
11*8
1936
96300
1419
1204
12*5
1448
15*0
298
59
48
39*9
1209
12*6
1937
96360
1518
1197
12*4
1465
15*2
302
54
57
47*6
1217
12*6
1938
96540
1556
1203
12*5
1294
13*4
283
60
56
46*6
1071
11*1
1939
96440
1704
1190
12-3
1458
14*7
368
65
52
41*7
1155
11*6
1940
103700
1847
1229
11-9
1812
17*5
418
52
69
49*0
1446
13*9
1941
108930
2101
1282
11*8
1776
16*3
450
69
91
52*9
1395
12*8
1942
101800
2133
1597
15*7
1468
14*4
362
61
68
42*6
1167
11-5
1943
98150
2244
1761
17-9
1616
16*5
390
64
69
39*2
1290
13*1
1944
100040
2627
2074
20*7
1583
15*8
416
53
96
46*3
1220
12*2
1945
98520
2412
1788
18*1
1586
16*1
382
69
72
40*3
1273
12*9
1946
102760
2847
2111
20*5
1571
15*3
399
59
97
45*9
1231
12*0
1947
104480
3000
2283
21-9
1606
15*4
363
43
76
33*3
1286
12*3
1948
104380
2518
1825
17*5
1543
14*8
401
54
68
37*3
1196
11*5
1949
104300
2377
1646
15*8
1581
15*2
414
92
49
29*8
1259
12*1
1950
105490
2497
1502
14*2
1547
14*7
397
113
28
18*6
1263
120
1951
103700
2510
1514
14*6
1668
16*1
391
137
45
29*7
1414
13*6
1952
103700
2583
1467
14*1
1489
14*4
358
91
32
21*8
1222
11*8
1953
104000
2592
1506
14*5
1650
15*9
346
36
35
23*2
1340
12*9
1954
103700
2536
1386
13*4
1566
15*1
376
48
28
20*2
1238
11*9
1955
102800
2472
1353
13*2
1570
15*3
390
56
24
17*7
1236
12*0
1956
101800
2612
1409
13*8
1640
16*1
411
60
34
24*1
1289
12*7
1957
101000
2736
1514
150
1581
15*7
408
48
25
16*5
1221
12*1
1958
100700
2864
1573
15*6
1625
16 1
416
118
30
19T
1327
13-2
1959
100300
2959
1625
16 2
1635
16*3
403
115
38
23-4
1347
13*4
1960
101180
3256
1686
16*7
1606
15 9
431
124
34
20-2
1299
A fc/ 1
12 8
This Table is arranged to shew the gross births and deaths in Northampton County
Borough and the births and deaths properly belonging to the town, with the corresponding
In 1931 and 1939 the death-rates are based on the estimated civil populations supplied
*he RengnSi!S*"General for that purP°se- The population for death-rate calculation in
1939 was 99,290.
Non-civilian deaths are excluded during the years 1939 to 1949.
NOTE: Table B (Cases of Notifiable Diseases) and Table C (Causes of Death) are inserted
after page 103.