

[Report 1960] / Medical Officer of Health, Northampton County Borough.
104/128
- Publication/creation
- 1960
- Contributors
- Northampton (England). County Borough Council.
- Type/technique
-
Electronic books
Annual reports
MOH reports
- Subjects
-
Disease Outbreaks
Public Health
Sanitation
Water Supply
Northampton (England)
- Attribution and usage
-
Wellcome Collection
You have permission to make copies of this work under a Creative Commons, Attribution license.
This licence permits unrestricted use, distribution, and reproduction in any medium, provided the original author and source are credited. See the Legal Code for further information.
Image source should be attributed as specified in the full catalogue record. If no source is given the image should be attributed to Wellcome Collection.
The image contains the following text:
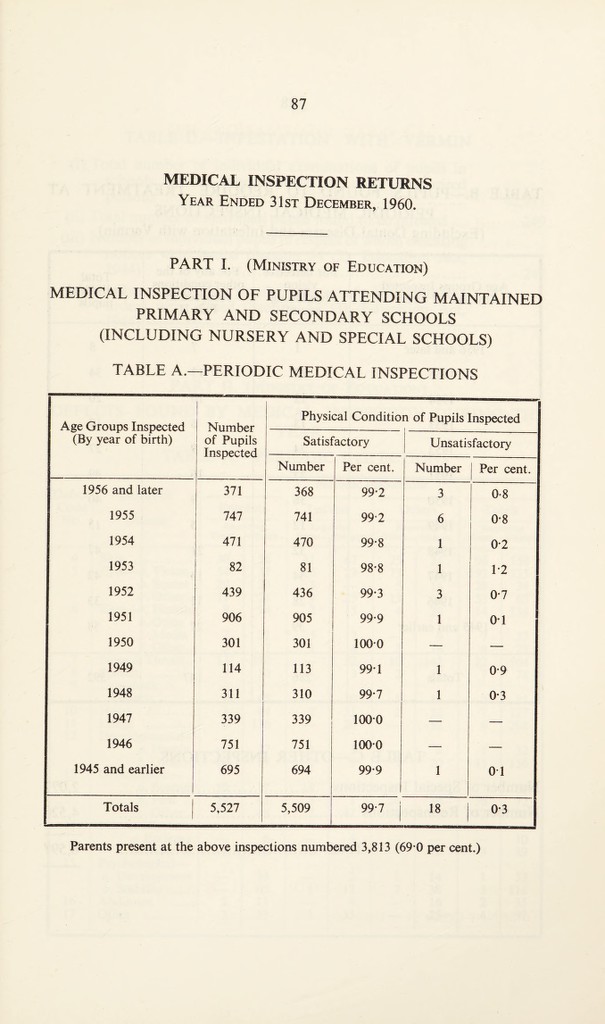
MEDICAL INSPECTION RETURNS
Year Ended 31st December, 1960.
PART I. (Ministry of Education)
MEDICAL INSPECTION OF PUPILS ATTENDING MAINTAINED
PRIMARY AND SECONDARY SCHOOLS
(INCLUDING NURSERY AND SPECIAL SCHOOLS)
TABLE A.—PERIODIC MEDICAL INSPECTIONS
Age Groups Inspected
(By year of birth)
1
Number
of Pupils
Inspected
Physical Conditio
n of Pupils Inspected
Satisfactory
Unsatisfactory
Number
Per cent.
Number
Per cent.
1956 and later
371
368
99-2
3
0-8
1955
747
741
99*2
6
0'8
1954
471
470
99-8
1
0-2
1953
82
81
98-8
1
1-2
1952
439
436
99-3
3
0*7
1951
906
905
99-9
1
0T
1950
301
301
1000
—
—
1949
114
113
99T
1
0-9
1948
311
310
99-7
1
0-3
1947
339
339
1000
—
—-
1946
751
751
1000
—
—
1945 and earlier
695
694
99-9
1
0T
Totals
5,527
5,509
99-7
18
0-3
Parents present at the above inspections numbered 3,813 (69-0 per cent.)