[Report 1960] / Medical Officer of Health, Northampton County Borough.
75/128
58 (canvas 76)
The image contains the following text:
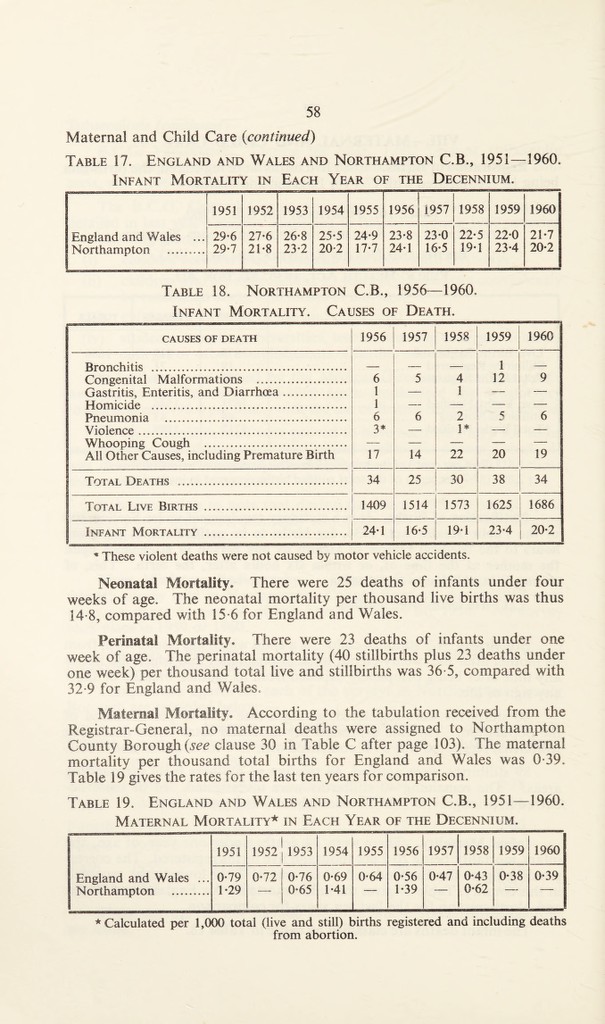
Maternal and Child Care (continued)
Table 17. England and Wales and Northampton C.B., 1951—1960.
Infant Mortality in Each Year of the Decennium.
England and Wales ...
Northampton
1951
1952
1953
1954
1955
1956
1957
1958
1959
1960
29-6
29-7
27-6
21-8
26-8
23-2
25-5
20*2
24-9
17-7
23- 8
24- 1
23-0
16*5
22-5
19-1
22-0
23-4
21*7
20-2
Table 18. Northampton C.B., 1956—1960.
Infant Mortality. Causes of Death.
CAUSES OF DEATH
1956
1957
1958
1959
1960
Bronchitis ......
_
—
—
1
—
Congenital Malformations ..
6
5
4
12
9
Gastritis, Enteritis, and Diarrhoea ...
1
—
1
—
—
Homicide ............
1
—
—
—
—
Pneumonia ......
6
6
2
5
6
Violence ......
3*
—
1*
—
—
Whooping Cough ...
—
—
—
20
—
All Other Causes, including Premature Birth
17
14
22
19
| Total Deaths ....
34
25
30
38
34
Total Live Births ....
1409
1514
1573
1625
1686
Infant Mortality ....
24*1
16-5
19*1
23*4
20-2
* These violent deaths were not caused by motor vehicle accidents.
Neonatal Mortality. There were 25 deaths of infants under four
weeks of age. The neonatal mortality per thousand live births was thus
14*8, compared with 15*6 for England and Wales.
Perinatal Mortality. There were 23 deaths of infants under one
week of age. The perinatal mortality (40 stillbirths plus 23 deaths under
one week) per thousand total live and stillbirths was 36-5, compared with
32-9 for England and Wales.
Maternal Mortality. According to the tabulation received from the
Registrar-General, no maternal deaths were assigned to Northampton
County Borough (see clause 30 in Table C after page 103). The maternal
mortality per thousand total births for England and Wales was 0-39.
Table 19 gives the rates for the last ten years for comparison.
Table 19. England and Wales and Northampton C.B., 1951—1960.
Maternal Mortality* in Each Year of the Decennium.
England and Wales ...
Northampton ..
1951
1952
1953
1954
1955
1956
1957
1958
1959
1960
0-79
1-29
0*72
0*76
0-65
0-69
1*41
0*64
0-56
1-39
0*47
0-43
0-62
0-38
0-39
* Calculated per 1,000 total (live and still) births registered and including deaths
from abortion.